
Test your install
Three ways to see the page views, identify and track calls your site sends, as they happen
Once the snippet is on your pages, the quickest way to know it works is to watch the events arrive. There are three ways to do that, from the one that needs nothing installed to the one that gives you the raw requests. Use the first for a normal install check and the others when something does not show up.
Whichever you use, the test is the same: open your site, load a page, submit the form or finish the action you track, and look for three kinds of events with the right contents.
- A page event for every page you load, carrying the URL and the referrer. Open a page through a link with a UTM parameter, such as
?utm_source=test, and check the parameter is in the URL the event carries. - An identify event when a user signs up or logs in, carrying the User ID and the traits you send, email above all.
- A track event for each conversion, carrying the event name and, for purchases, the
revenueproperty.
Events Stream in Settings
Go to Settings → Events Stream and press Start. In another tab, browse your site. Each page view, identify and track call appears in the list within a second or two, newest first. Click a row to see the raw event on the right, with the full properties and context your site sent.
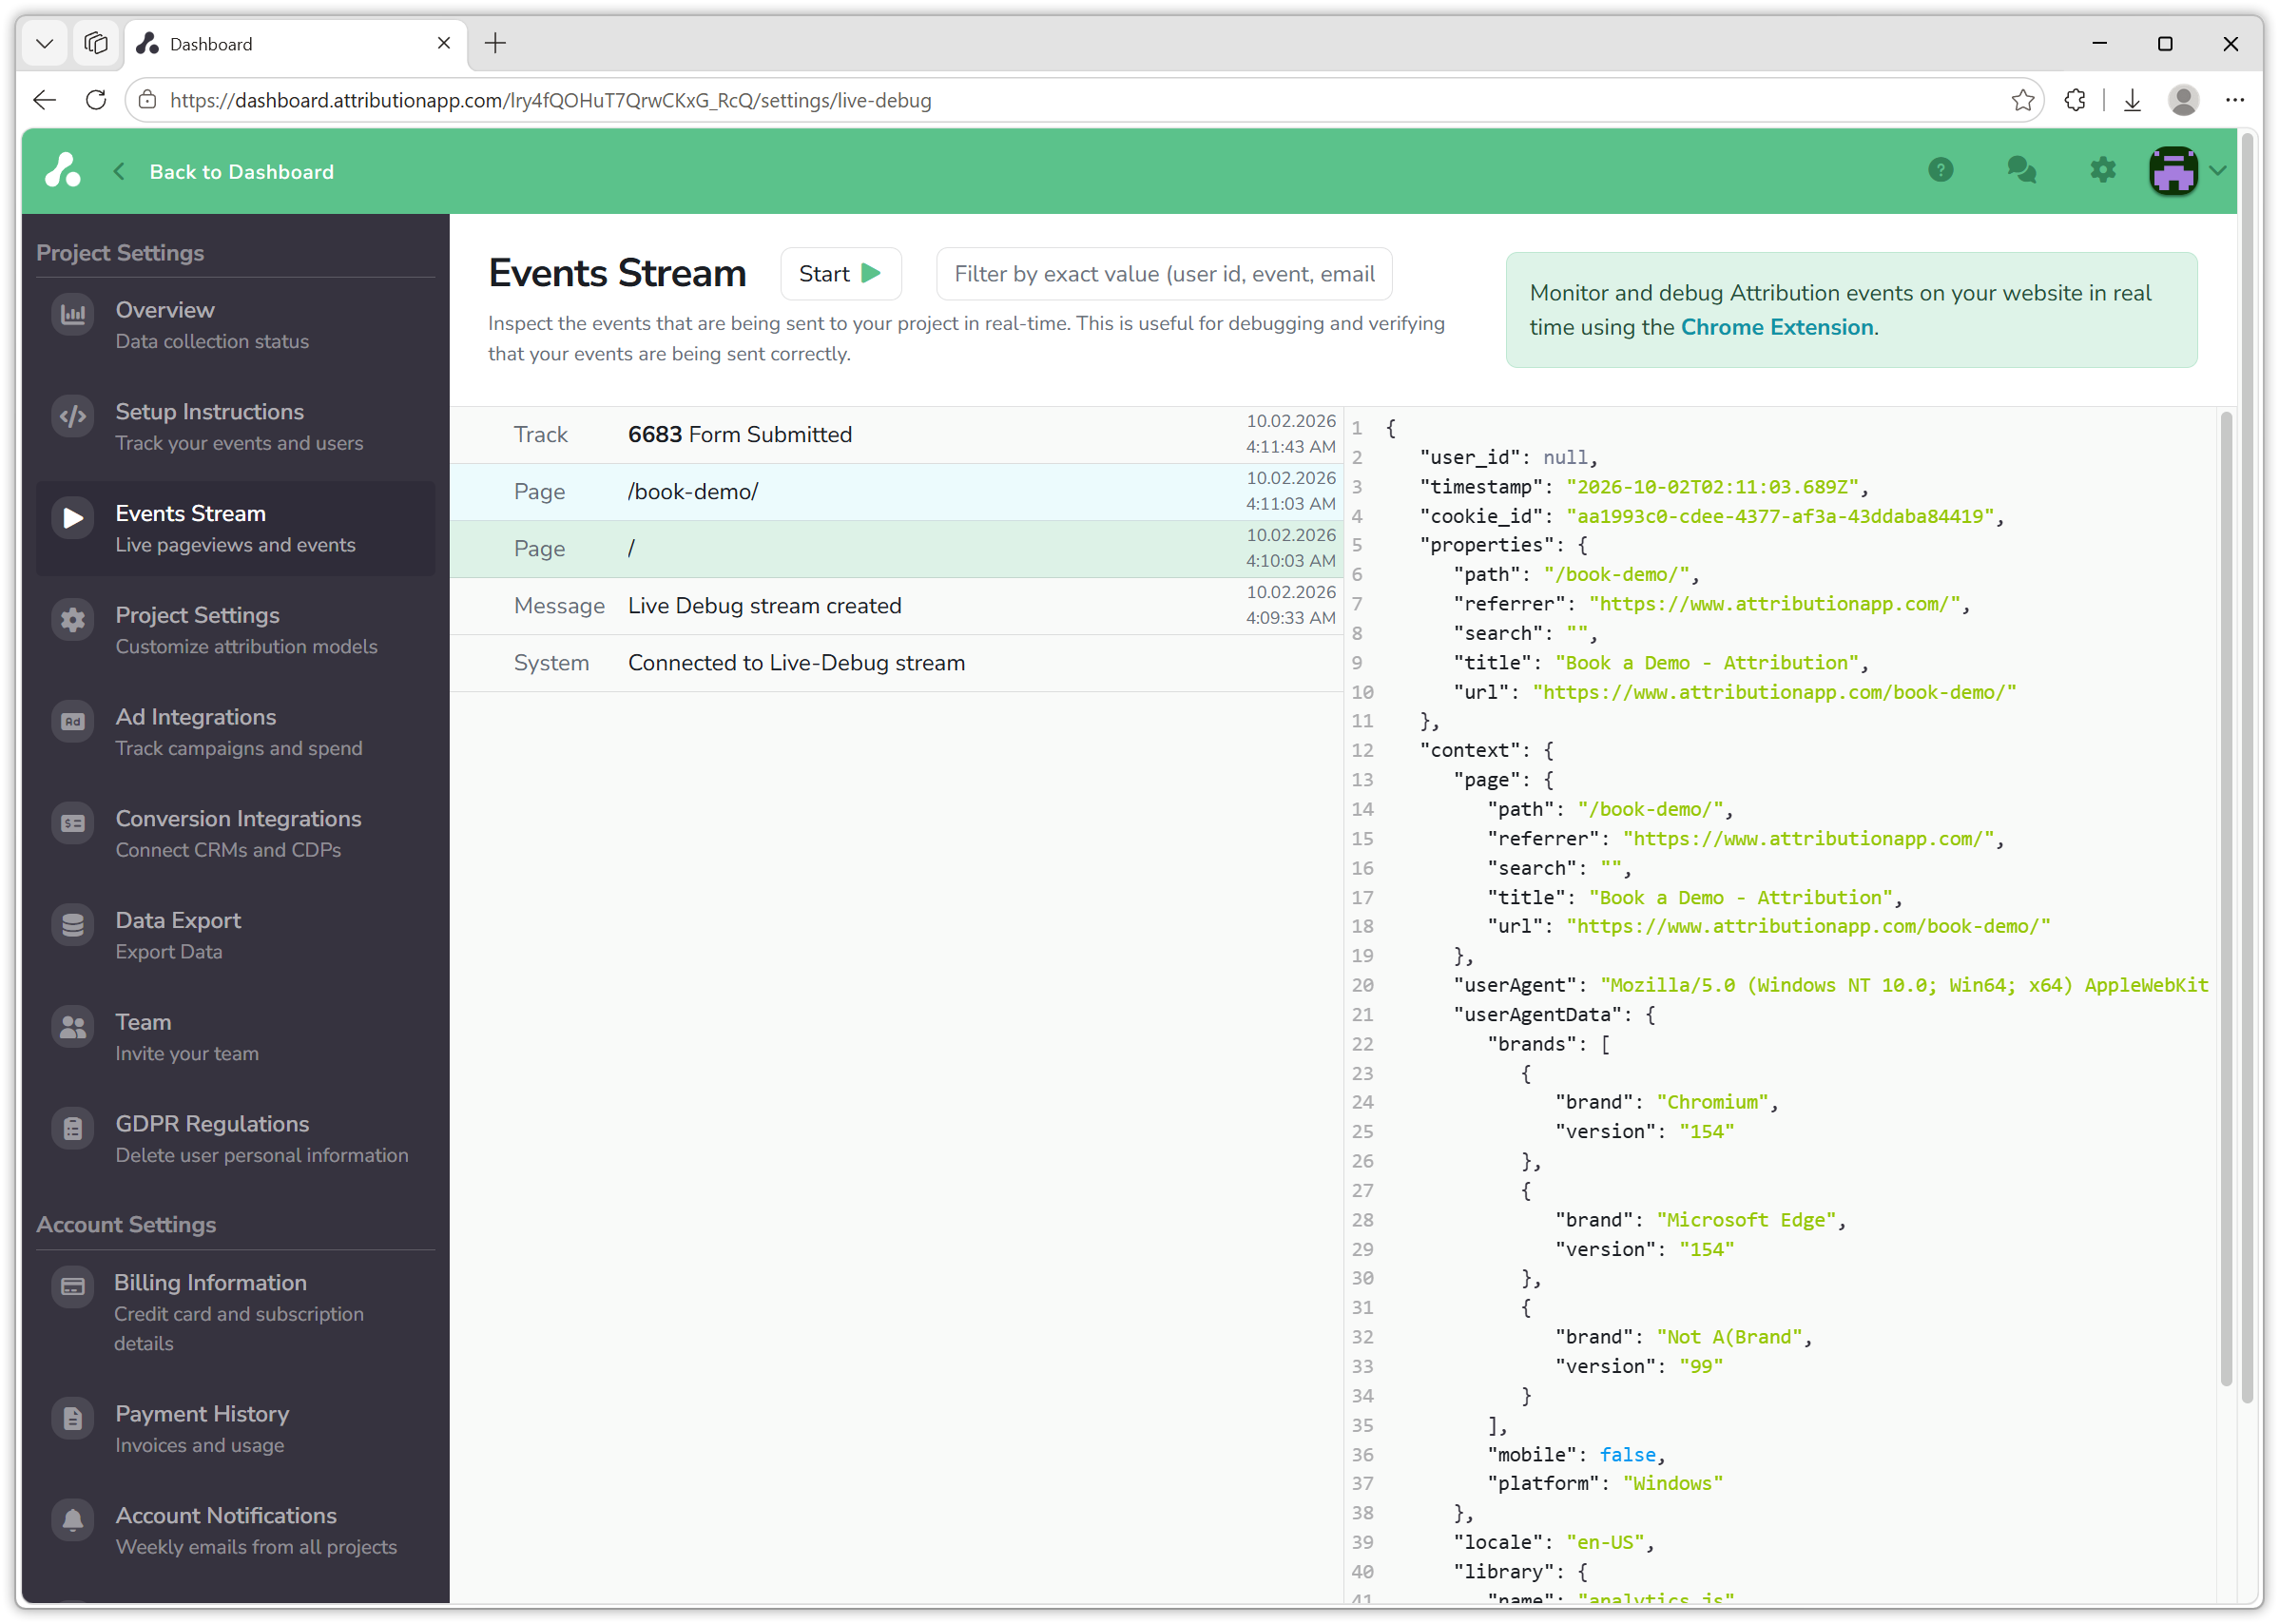
The filter box narrows the list to an exact value, so you can type your own email or User ID and see only your own session while others browse the site. The stream shows what reaches Attribution live; the dashboard itself shows those visits and conversions after its next data refresh, so do not expect the numbers to move at once.
Browser extension
The snippet follows the Segment event specification, so the Segment Event Tracker extension for Chrome works with Attribution. Install it, open your site, and open the extension from the toolbar or from its panel in the browser's developer tools. It lists every page, identify and track call the page fires, with the properties, as you click through your site. It is the fastest way to see what a single page sends without leaving the tab.
Developer tools
For the raw requests, open your browser's developer tools on a page of your site.
Network tab. Filter by attribution. You should see attribution.js load with status 200 when the page opens, then one request for each page view, identify and track call. Click a request and open its payload to see exactly what was sent. If attribution.js is missing, the snippet is not on the page or a content blocker stopped it; if it loads but no events follow, check the browser console for errors.
Console. The snippet exposes the Attribution object, so you can send events by hand and watch them land in the Events Stream:
Attribution.page();
Attribution.identify('test-user-1', { email: '[email protected]' });
Attribution.track('Test Event', { revenue: 1 });
If the console reports Attribution snippet included twice, the snippet is on the page more than once, usually once in the template and once in a tag manager; keep one.
Events you send while testing are real events in your project. Use names you will recognise, such as "Test Event", or test in a separate project if you have one.
The overall picture in Settings
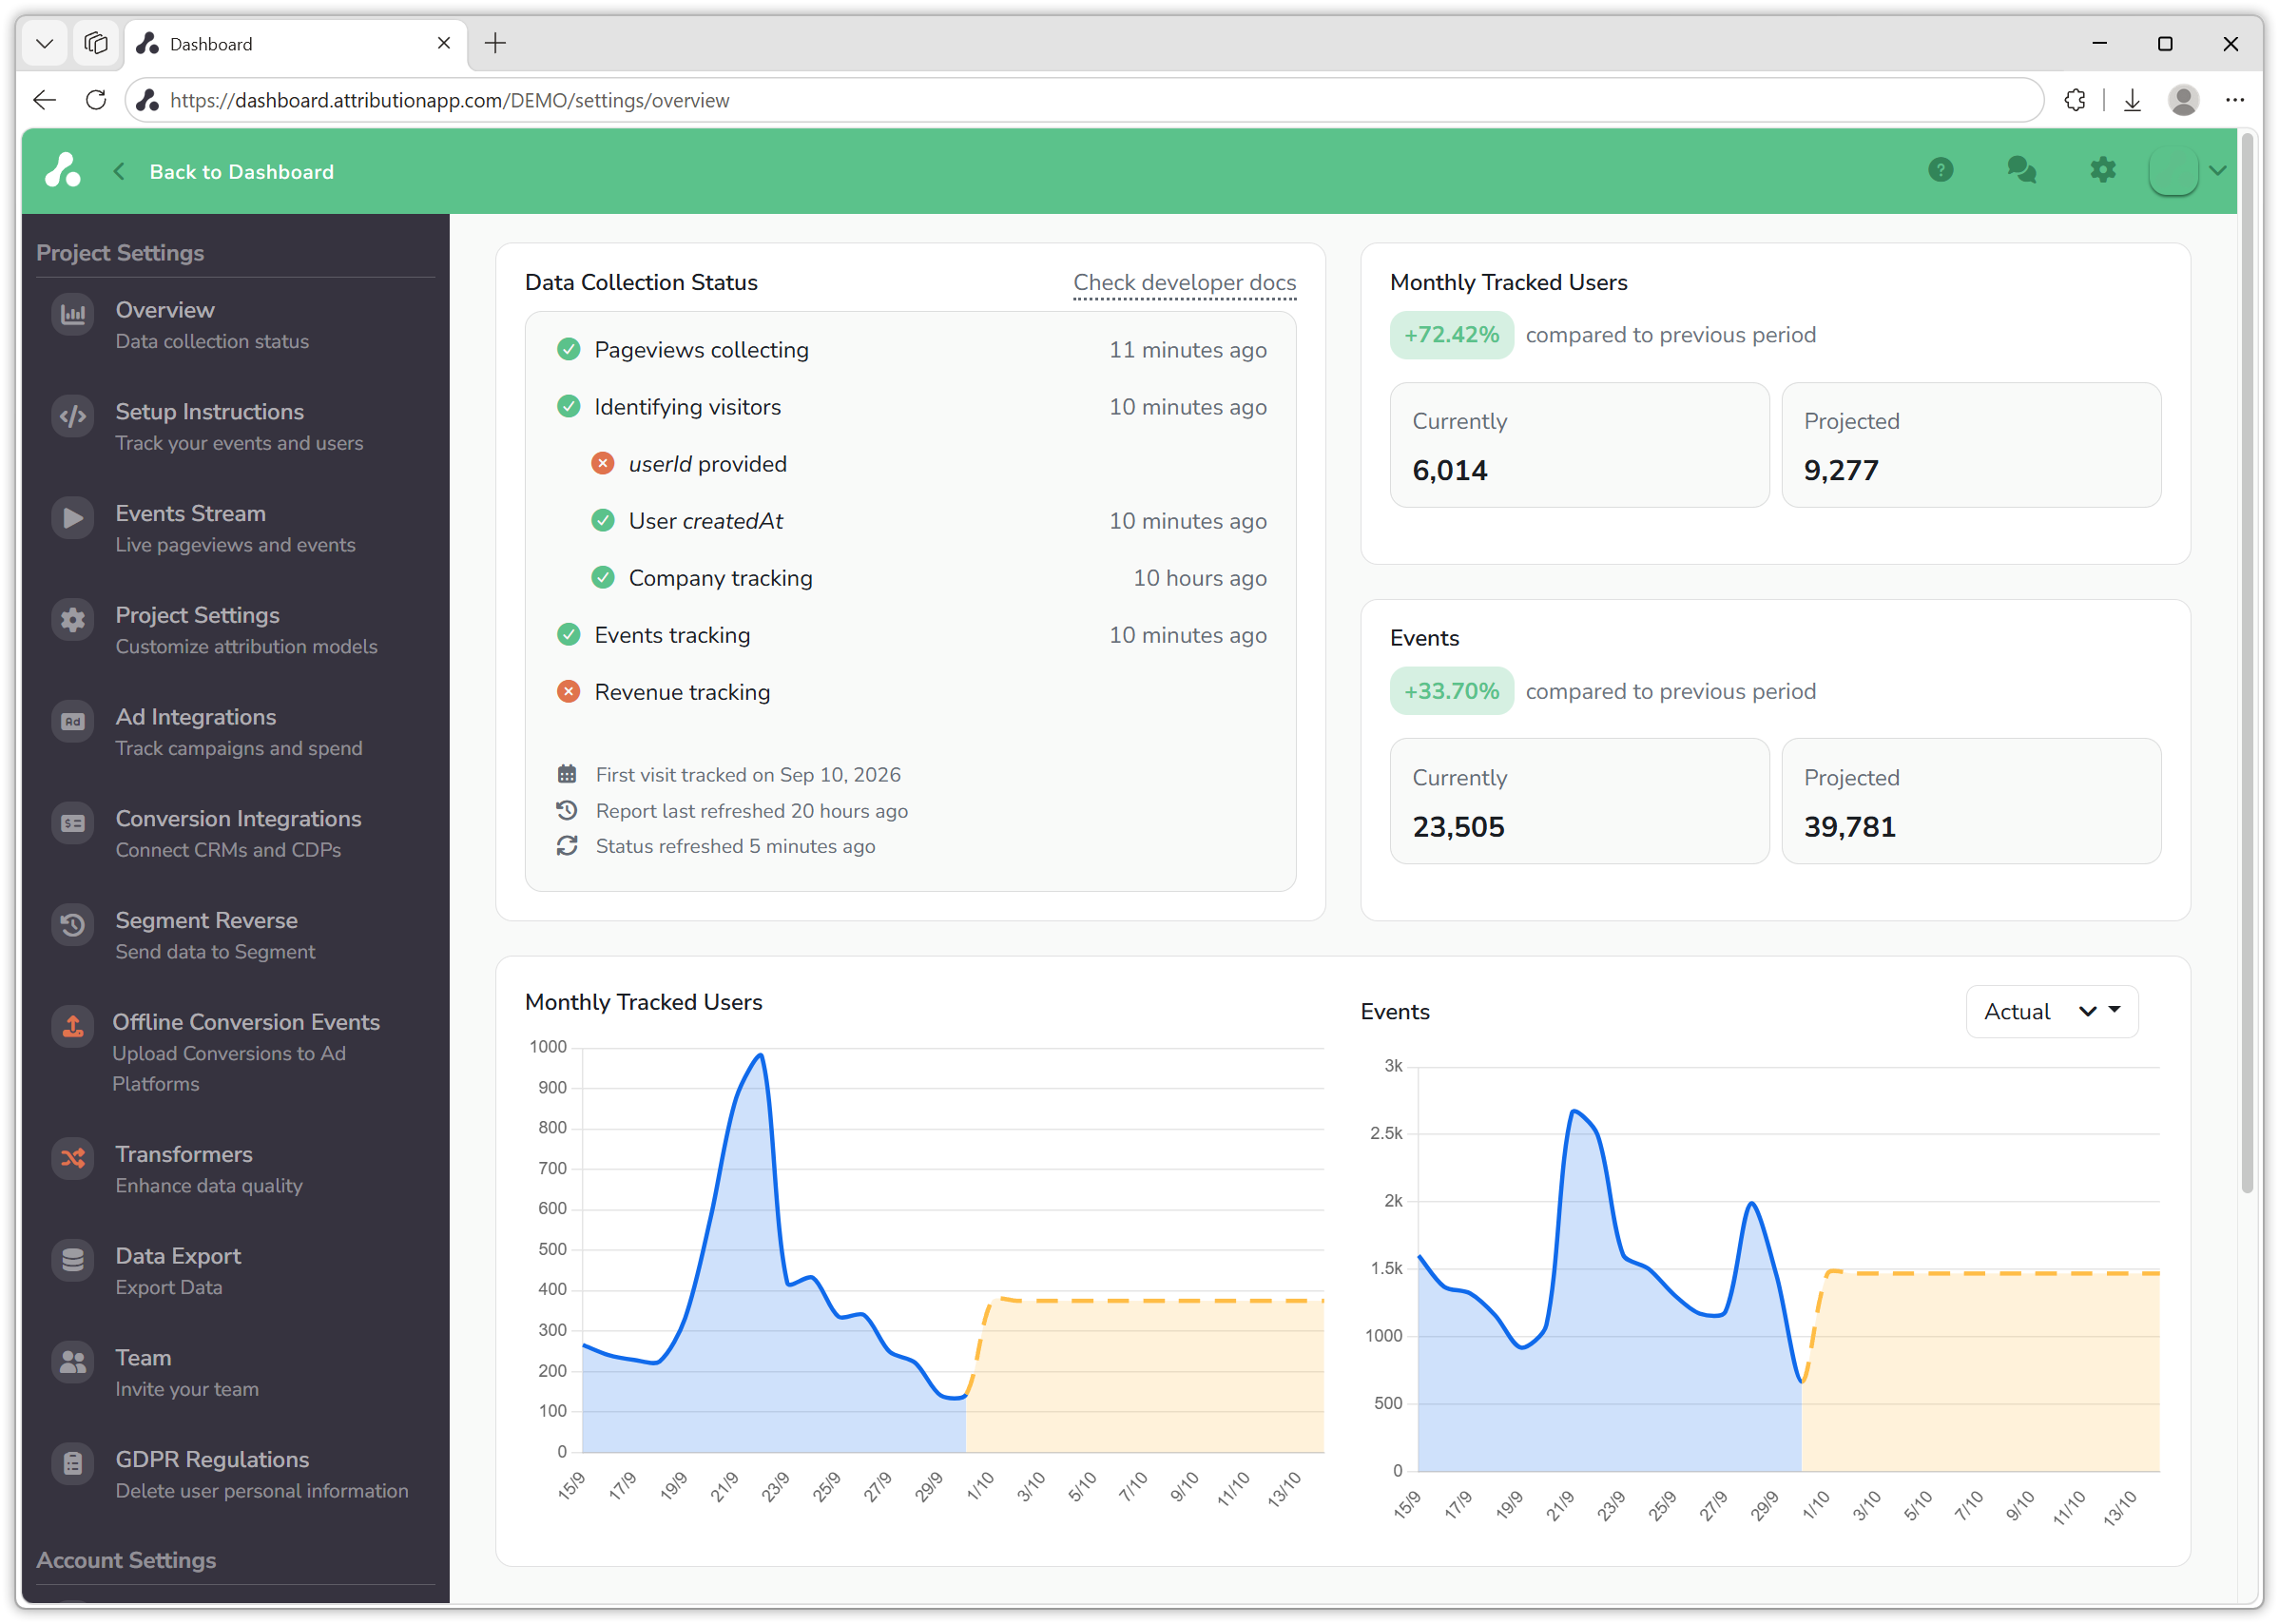
Once events are flowing, Settings → Overview shows the status of your data collection as a whole: whether page views, identifies, events and revenue are arriving, and how long ago each was last seen. A red mark next to an item means Attribution has not received that kind of data; after an install, revenue tracking stays red until the first conversion with a revenue property comes in, and userId provided stays red until identify calls carry a User ID. The page also shows when the first visit was tracked and when the reports were last refreshed, which answers the "why is the dashboard not showing it yet" question.
What to check when something is missing
- No events at all. The snippet is not on the page, is blocked, or was minified or bundled; see the install notes on bundling.
- Page events without UTM parameters. The parameters were stripped by a redirect before the page loaded; check the landing URL the ad points at.
- Conversions in Unknown Source. The person was not identified before the conversion reached Attribution, from your site or from a CRM or billing integration. Make sure
identify()runs with the email before the form or purchase completes. - Revenue not counted. The track event has no
revenueproperty, or it is a formatted string; send a plain number.
If you have any questions please reach out to [email protected].
Updated 20 days ago